Using GoAccess to Monitor Multiple Websites at Once

I've been building and hosting websites for a long time, and one of the things that has always bugged me is the lack of out-of-the-box solutions for what I think of as mid-level web server monitoring. The market is saturated with enterprise-level solutions, and they're great for large operations and folks that use them in a professional environment.
If you're looking for better data than you can get from Google Analytics but you're not fluent in reading Apache or Nginx logs, then you kind of find yourself in no man's land.
After many years of half-heartedly trying different solutions, I finally came across an open source project that fills that gap for me, GoAccess. After a few days of tinkering around with it and trying different implementations, I found a pretty good set up that I'll lay out below.
Table of Contents
- The Goal
- The Setup
- Installing GoAccess
- How GoAccess Works
- Run Your First Report
- Aggregate Reporting
- Separating Log Files
- Run Single Domain Report
- Increasing the Date Range
- Run Multiple Reports Simultaneously
- Which Output Directory to Use
- Automate Reporting
- Unexplored Features
- Final Thoughts
- More WebDev Guides
The Goal
As a site speed junkie with an interest in web security, I wanted to understand things like what pages the nefarious bots were targeting and why is my CDN is reporting the largest bandwidth usage from countries that don't even show up in my GA reports.
What I wanted was something that basically took the raw data from my web server log files and turned them into something usable. While there are a number of options for that, every time I started building a Grafana dashboard and trying to integrate Loki into my systems, it felt like I was building a rocket ship to go pick up milk at the corner store instead of just riding a bike.
While I do plan on integrating these more robust systems in the future, I wanted to get something working so I can continue my never-ending quest for more site speed.
That being said, lets get into it.
The Setup
This is what I'm using, so the guide will focus primarily around these services:
- Debian-based server OS
- Apache Web Server
- Apache Virtual Hosts
- GoAccess Monitor
Installing GoAccess
The install is incredibly easy and requires no dependencies or extra services.
sudo apt updatesudo apt install goaccessThat's it. You can actually run reports from here, but we are going to make it a little more functional first.
How GoAccess Works
GoAccess parses through your web server log files and builds a report based on the data. You can have it do a snapshot on the fly, or you can configure it for real-time monitoring. You can view the data through the command line or as an html file you can open up right in your browser.
If you're running the default setup on Apache or Nginx and haven't changed the output structure of your logs, GoAccess will read them right out of the box. There are a number of ways you can customize your log reporting, but if you already know how to do that you probably don't need my help setting this up.
Apache & Nginx Default Log Locations
Speaking of default set ups, here are the default locations for the primary log files. You will need these later:
Apache - /var/log/apache2/access.log
Nginx - /var/log/nginx/access.log
Run Your First Report
The command for building an HTML report is pretty straight forward (Don't run this first one):
goaccess LOG-LOCATION -o OUTPUT-LOCATION --log-format=COMBINEDLOG-LOCATION - Where is the log file you want to use?
OUTPUT-LOCATION - Where do you want the HTML file to be created?
So if you're using the default log location on Apache and its writing to the log file called access.log, you can run this:
sudo goaccess /var/log/apache2/access.log -o /var/www/html/report.html --log-format=COMBINEDNote: I added sudo to the command because its likely your ssh user doesn't have access to the log directory that Apache writes to. If it does (or you're logged in as root) you may want to revisit your permissions setup.
View Your First Report
Assuming everything worked correctly, your report is now available at /var/www/html/report.html. If your server is configured to display html files in that directory, you can view it by going to http://your-server-ip/report.html. If its not, just go grab the report.html file out of the /var/www/html/ directory, copy it to your computer and open it.
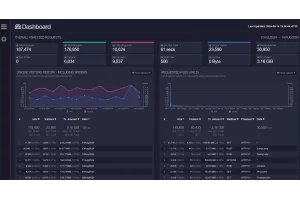
You should see something like this:

Aggregate Reporting
When I set up this particular web server a few years back, I used the same virtual host configuration template for each domain and didn't tweak them much. Each one had these directives for log reporting:
ErrorLog ${APACHE_LOG_DIR}/error.log
CustomLog ${APACHE_LOG_DIR}/access.log combined
So every log entry was combined into the same error and access log file. Therefore, when I ran the command above to generate a report using access.log, the data it presented was an aggregate of all the websites I host on the server. While this was good for getting a macro view, I also wanted to see each site individually.
Separating Log Files
If you're thinking that GoAccess should be able to separate out the different virtual hosts when it parses the file, you are correct. It involves adding additional flags to your log file entries and customizing the way GoAccess reads and parses them. I originally started down that path but decided against it for a few reasons:
- When I over-customize things I know I'm not going to revisit for a long time, I tend to forget why and how I did it.
- I wasn't completely sure what the reporting would look like, and knew I would be happy if I had the same macro data from the
access.logfile available on an individual domain basis. - After running into multiple parsing errors when attempting this, I realized I was down a rabbit hole inside another rabbit hole.
If you want to give it a try, I suggest starting with the GoAccess Manual Page.
CustomLog Directives
Note: I explain where these are and how to edit them in the next section.
I mentioned above that all my virtual host configs were set up to log everything to the same files, error.log and access.log:
ErrorLog ${APACHE_LOG_DIR}/error.log
CustomLog ${APACHE_LOG_DIR}/access.log combined
These log files are important and can be used by other reporting tools, so I didn't want to change this. Instead, I added a custom log file for each domain I wanted individual reporting on. For simplicity sake, I just used the domain name itself so the updated version for this website looks like this:
ErrorLog ${APACHE_LOG_DIR}/error.log
CustomLog ${APACHE_LOG_DIR}/access.log combined
CustomLog ${APACHE_LOG_DIR}/ericjstauffer.log combined
What this does is create a new log file called ericjstauffer.log in the same directory that the default access.log file lives. I did the same thing for each of the other domains I wanted to track individually.
Updating Virtual Host Configs
If you are new to updating virtual host configuration files or haven't done it in a while, here is step-by-step process to make the edits mentioned above. I'm not going to dive too much into the other aspects of virtual host configs.
If this is old hat, jump to the next section.
Note: The following is for Apache, so adjust accordingly if your using Nginx.
The config files are located in /etc/apache2/sites-available. When a conf file is activated, its copied into /etc/apache2/sites-enabled. Make your edits in sites-available.
Move into the directory and view the current configs available:
cd /etc/apache2/sites-availablels -lYou should see the config files that correspond with each of your domains (or subdomains, but that's a different discussion).
Open the file you want to edit:
sudo nano mydomain.confYou should see something that resembles this. It may be in a different order or have differing information, but that is beyond the scope of this guide:
<VirtualHost *:443>
    ServerAdmin webmaster@yourdomain.com
    ServerName yourdomain.com
    ServerAlias www.yourdomain.com

    DocumentRoot /var/www/yourdomain.com/public_html

    # SSL configuration
    SSLEngine on
    SSLCertificateFile /etc/ssl/certs/yourdomain.com.crt
    SSLCertificateKeyFile /etc/ssl/private/yourdomain.com.key
    SSLCertificateChainFile /etc/ssl/certs/yourdomain.com.ca-bundle

    # Redirect HTTP to HTTPS
    <IfModule mod_rewrite.c>
        RewriteEngine On
        RewriteCond %{HTTPS} off
        RewriteRule ^ https://%{HTTP_HOST}%{REQUEST_URI} [L,R=301]
    </IfModule>

    # Security headers
    Header always set X-Frame-Options DENY
    Header always set X-Content-Type-Options nosniff

    ErrorLog ${APACHE_LOG_DIR}/error.log
    CustomLog ${APACHE_LOG_DIR}/access.log combined

    # Optionally, enable HTTP/2
    Protocols h2 http/1.1
</VirtualHost>
The only part we are focused on right now is this (yours may have different filenames):
ErrorLog ${APACHE_LOG_DIR}/error.log
CustomLog ${APACHE_LOG_DIR}/access.log combined
If your conf file is using the default access.log file and doesn't have a custom file name, simply add a new line so it looks like this:
ErrorLog ${APACHE_LOG_DIR}/error.log
CustomLog ${APACHE_LOG_DIR}/access.log combined
CustomLog ${APACHE_LOG_DIR}/DOMAINNAME.log combined
When you're done making edits, ctrl + x will save and close the file.
Now restart (or reload) Apache to make the edits live:
sudo service apache2 restart(I know... I know... systemctl. Old habits die hard.)
IMPORTANT: Repeat these edits for any domains you want custom reporting.

Run Single Domain Report
Once the virtual host config files are updated, Apache (or Nginx) will start generating individual log reports for these domains. You can verify this by listing the files in the apache log directory.
Two quick caveats:
- Apache does not create the file until the first time it needs to log something. If you have a small site, you may need to visit it yourself to force the first log event.
- Its plausible your ssh user doesn't have access to the log directory, so you can't
cdinto it. Sincesudo cdisn't a valid command, you can use this as a workaround:
sudo ls -l /var/log/apache2/This should list the directory contents and you should see the new log files.
Note: If you see a bunch of gzip files like access.log.5.gz, that's normal and we will get to that shortly.
Earlier we used the following structure to generate the first report from the access.log file:
goaccess LOG-LOCATION -o OUTPUT-LOCATION --log-format=COMBINEDWe are going to use this same structure to generate the first individual domain report. Using the new log file name you added to your Apache virtual host config file earlier, replace NEWLOGFILENAME and DOMAINNAME and run this command:
goaccess /var/log/apache2/NEWLOGFILENAME.log -o /var/www/html/DOMAINNAME.html --log-format=COMBINEDYou should now have a completed report in your /var/www/html directory, but this one is specific to a single domain. I should note that the data will probably be pretty thin because the log file is brand new.
Increasing the Date Range
Standard Apache configurations compress, rotate and purge old log files to conserve space. Log files can get quite large, and servers could run out of space if it didn't. This process is managed globally by logrotate. These settings can be changed, and custom logrotate configurations can be created for specific logs. The nuts and bolts of this is a story for another time, but I mention it in case you want to research more on the topic.
If you haven't changed these settings, Apache is likely storing your logs for 15 days before purging. This is why you may see a file list like this in the log folder:
access.log
access.log.1
access.log.2.gz
access.log.3.gz
access.log.4.gz
After your new logs have been generating for a few days, they should start to resemble the same pattern.
You may have noticed when creating the first two reports that it only showed one day of data (if your settings are the same as mine). Its because the access.log file only includes the most recent logs. The good news is we can generate reports using all these files at the same time. GoAccess even decompresses them on the fly, so it doesn't need to save the decompressed copies anywhere on your system after it snags the data.
Here is the command to view all the access logs. Go ahead and try it:
sudo bash -c '(zcat -f /var/log/apache2/access.log*.gz; cat /var/log/apache2/access.log*) | goaccess - -o /var/www/html/full-report.html --log-format=COMBINED'You should see the extended date range in the report now:

Run Multiple Reports Simultaneously
If you have multiple websites on your web server, running each report individually will get tiresome. Now I'll walk you through creating a bash script that runs all the reports at the same time. This makes creating new reports quick and easy, and allows for expanding the setup through scheduling and automation.
Note: This uses sudo in the script itself, which isn't considered best practice. Because user permissions are outside the purview of this guide, its written this way so that it will function correctly for the majority of users. Its fine to run this with your ssh user account, just remember its in there if you start getting into more advanced automation.
Create the Script File
If you're familiar with scripting and/or have a different location you store them, go ahead and jump down to the script itself. If you're new to it or need a refresher, we'll keep it simple and stay in your user's home folder.
Move to your home folder:
cd ~Make a new directory:
mkdir scriptscd scriptsCreate the script file:
nano goaccess-multi-reports.shPaste the following:
#!/bin/bash

# List of domain names
domains=(
  "domain1"
  "domain2"
  "domain3"
  "domain4"
  "domain5"
  "domain6"
  "domain7"
  "domain8"
)

# Directory where Apache logs are stored
log_dir="/var/log/apache2"

# Directory where the reports will be saved
report_dir="/var/www/html"

for domain in "${domains[@]}"; do
  echo "Generating report for $domain..."

  # Run goaccess for each domain
  sudo bash -c "(zcat -f ${log_dir}/${domain}.log*.gz; cat ${log_dir}/${domain}.log*) | goaccess - -o ${report_dir}/${domain}.html --log-format=COMBINED"

  echo "Report for $domain saved to ${report_dir}/${domain}.html"
done

echo "All reports generated."
Domains
The domains section at the top is where you put the base part of each log file name. So if your logs are named mydomain.log and myseconddomain.log, you would put mydomain and myseconddomain. DON'T PUT .log AT THE END!
Add or remove any extra domains from the template above to match your setup.
Log Directory
Make sure log_dir="/var/log/apache2" matches your Apache (or Nginx) log directory. Do not put a trailing / on the end.
Report Directory
Make sure report_dir="/var/www/html" matches where you want the HTML files to go (more on this shortly). Do not put a trailing / on the end.
Save & Make Executable
Once the script is customized to your setup, hit ctrl + x to save/exit the file, then run the following command to make it executable:
chmod +x goaccess-multi-reports.shRun the Multi-Report Script
Now all you have to do is run the script:
sudo bash goaccess-multi-reports.shYou should see "Generating report for yourlognamehere..." while it starts parsing through the first file. Its OK if you see gzip: /var/log/apache2/yourlognamehere.log*.gz: No such file or directory while its processing. This will go away after a few days when some of the first log files are converted into .gz files.
If everything has gone according to plan and the script completes successfully, you should now see individual html reports for each of your websites in the output folder. Remember, these new reports will only show data starting from when you updated the virtual hosts onward.
Which Output Directory to Use
Up to this point we have been using /var/www/html as the output directory, because that is the default for a new GoAccess install. The purpose of putting them here is because a lot of servers are already set up to serve html files from this directory via a web browser. In reality, you can make the output folder anything you want as long as it can write to that folder.
Reports Available Online
If you need to share these reports with multiple people, the default output folder is a good starting point. Once the reports run, they are available immediately for anyone to see. Note: If this is a public-facing server, you will probably want to secure that directory with a log in.
You can even get fancy and create a domain or subdomain that points to the reports, like https://reports.mydomain.com.
Downloading Reports
If you don't want to mess around with securing the output directory, you can simply change it to a different location on your server.
Go to your home directory:
cd ~mkdir reportsNow go back to the script and change this line:
report_dir="/var/www/html"to this:
report_dir="/home/YOURUSER/reports"Remember to leave the trailing / off.
Now whenever the reports are run, they will generate in the reports folder inside your home directory.
Automate Reporting
The easiest way to automate these reports is creating a Cron Job to run the script at whatever schedule you prefer. If you're unfamiliar with Cron Jobs, I suggest looking at the following resources. It's pretty simple once you get the hang of it.
Note: Our current script overwrites the previous files, so you're always looking at the most recent reports.
Unexplored Features
I've only scratched the surface on what can be done with GoAccess, so its feels appropriate to mention a few of their marque features I haven't covered in this post. I do plan on diving deeper into these, and I'll write about my findings once I do. For those like me that love to explore rabbit holes, here's a couple areas to get you started:
- Real-time Reporting - GoAccess provides real-time reporting capabilities right out of the box if you always want up-to-the-minute data.
- Terminal Dashboard - For those that live in a terminal window, you can skip the html files and get all your reporting without leaving the command line.
If you're interested in exploring these, I suggest starting with their Manual Page.
Final Thoughts
There's a lot of implementation possibilities for GoAccess, and I'm excited to keep tinkering with it. I'll come back and update this post if/when I come across anything worth sharing.
If you get stuck or have a question/comment/concern, feel free to reach out to me directly.